Tachykinin receptor 3 (TACR3) is a member of the tachykinin receptor family and falls within the rhodopsin subfamily. As a G protein-coupled receptor, it responds to neurokinin B (NKB), its high-affinity ligand. Dysfunctional TACR3 has been associated with pubertal failure and anxiety, yet the mechanisms underlying this remain unclear. Hence, we have investigated the relationship between TACR3 expression, anxiety, sex hormones, and synaptic plasticity in a rat model, which indicated that severe anxiety is linked to dampened TACR3 expression in the ventral hippocampus. TACR3 expression in female rats fluctuates during the estrous cycle, reflecting sensitivity to sex hormones. Indeed, in males, sexual development is associated with a substantial increase in hippocampal TACR3 expression, coinciding with elevated serum testosterone and a significant reduction in anxiety. TACR3 is predominantly expressed in the cell membrane, including the presynaptic compartment, and its modulation significantly influences synaptic activity. Inhibition of TACR3 activity provokes hyperactivation of CaMKII and enhanced AMPA receptor phosphorylation, associated with an increase in spine density. Using a multielectrode array, stronger cross-correlation of firing was evident among neurons following TACR3 inhibition, indicating enhanced connectivity. Deficient TACR3 activity in rats led to lower serum testosterone levels, as well as increased spine density and impaired long-term potentiation (LTP) in the dentate gyrus. Remarkably, aberrant expression of functional TACR3 in spines results in spine shrinkage and pruning, while expression of defective TACR3 increases spine density, size, and the magnitude of cross-correlation. The firing pattern in response to LTP induction was inadequate in neurons expressing defective TACR3, which could be rectified by treatment with testosterone. In conclusion, our study provides valuable insights into the intricate interplay between TACR3, sex hormones, anxiety, and synaptic plasticity. These findings highlight potential targets for therapeutic interventions to alleviate anxiety in individuals with TACR3 dysfunction and the implications of TACR3 in anxiety-related neural changes provide an avenue for future research in the field.
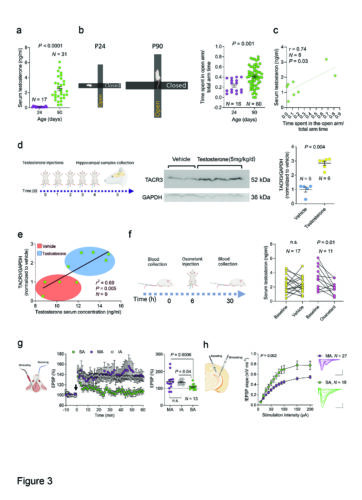
The interaction between TACR3 expression, testosterone levels, and rat anxiety-like behavior.
a Using ELISA, Serum testosterone levels were measured in male rats on postnatal days 24 (P24) and 90 (P90). The graph displays the values for each rat and the mean ± SEM testosterone levels (ng/ml) in each age group. The testosterone levels increased significantly from P24 to P90, and the statistical significance was determined using the Mann-Whitney test. N represents the number of rats in each group. b Left: A schematic representation of the elevated plus-mazes used for behavioral testing of P24 (left) and P90 (right) male rats. The maze size was proportionally similar to the size of the rats, ensuring appropriate scaling for the experimental conditions. Right: The graph illustrates the scores from the EPM test in P24 and P90 rats. P90 rats exhibited a significantly higher score, spending more time in the open arms of the maze compared to P24 rats. This observation suggests P90 rats display less intense anxiety-like behavior as they have a greater propensity to explore the open areas of the maze. Each dot represents the score of a single rat in the test, and the data are also presented as the mean ± SEM. The statistical significance was determined using the Mann-Whitney test, and N represents the number of rats in each group. c Correlation between the serum testosterone levels and EPM score for individual male rats (3 months old). Statistical significance was determined using Pearson’s correlation, and N represents the number of rats. d Left: Scheme of the experimental design. Male rats were randomly assigned to a testosterone or control group (vehicle), with the rats in the testosterone group receiving daily subcutaneous injections of testosterone propionate (5 mg/kg) over five consecutive days. On the sixth day, the rats were sacrificed, and the hippocampus was collected for analysis. Middle: Western blot of TACR3 expression in the hippocampus. Right. A graph showing the quantification of TACR3 protein expression demonstrating a significant upregulation of TACR3 expression in the hippocampus of testosterone-treated rats relative to the control rats. Each dot represents the value of one rat and the statistical significance was determined using a Mann-Whitney test. N represents the number of rats in each group. e The correlation between serum testosterone levels and hippocampal TACR3 expression for individual male rats (3 months old) demonstrating a positive correlation between serum testosterone and hippocampal TACR3 expression. Statistical significance was determined using Pearson’s correlation and N represents the number of rats. f Left: Scheme of the experimental design used to examine the effect of osanetant on the serum testosterone levels in rats. Rats were randomly divided into two groups: a treatment group receiving a single intraperitoneal dose of osanetant (5 mg/kg) and a control group receiving the vehicle alone. Blood samples were collected from each rat via tail puncture 6 h before and 24 h after the treatment, measuring the testosterone levels in the serum. The graph on the right displays the individual values of the rats before and after osanetant or vehicle treatment. Statistical significance was determined using a Paired t test, evaluating the changes within each group, and N represents the number of rats. g Left: Representation of a rat head indicating the location of the stimulating and recording electrodes. Middle: In vivo LTP in the dentate gyrus of rats categorized as MA, IA, and SA, highlighting the LTP impairment in SA rats. Right: Quantification of the EPSP changes in the last 10 min of the recording. Each dot represents the value of a single rat and N represents the number of rats. Statistical significance was determined using a Kruskal-Wallis test followed by Dunn’s multiple comparisons tests. h Left: A diagram illustrating a hippocampal slice, delineating the positioning of both the stimulating and recording electrodes during field potential recording within the dentate gyrus. Middle: Input-output curves representing field excitatory postsynaptic potentials (fEPSPs) induced by stimulation of perforant path axons in slices of MA and SA rats. Right: Overlay of sample fEPSPs at increasing stimulation intensities from 10 to 200 μA. P-values were calculated using a two-way ANOVA, and N represents the number of slices. The scale bars applicable to all panels are set at 0.5 mV and 20 ms, and the data are presented as the mean ± standard error of the mean (SEM), as shown by the error bars.